Jumpstart Your Data Visualization: Quarto & ObservableJS with R
Let’s run the hello quarto
Getting quarto installed
Download it from the download page.
I download the ubuntu version and installed it with:f
sudo dpkg -i quarto-*.deb
Cool.
Now running quarto --version should print:
1.5.55
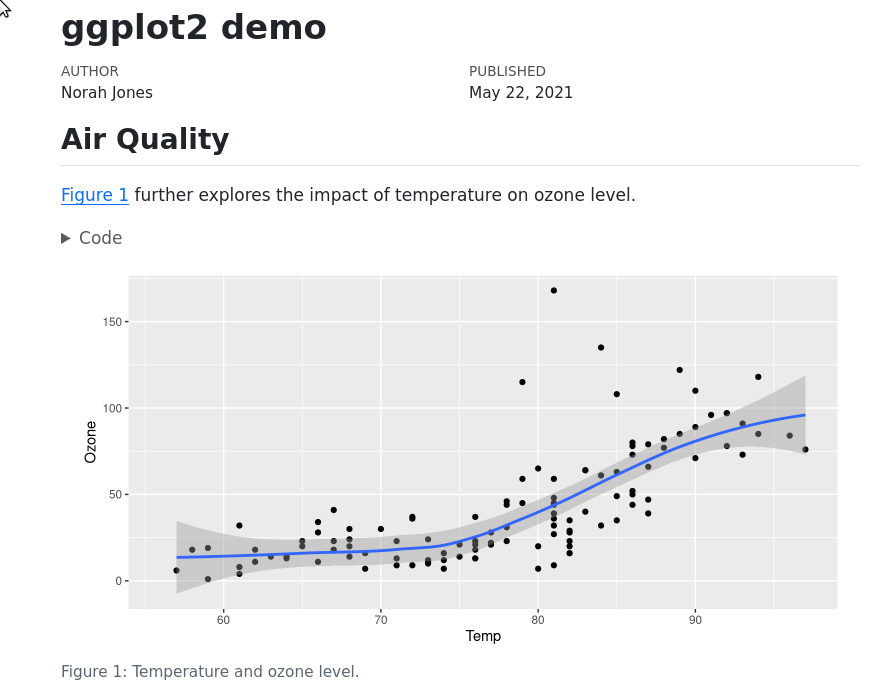
Hello quarto
Create a file named hello.qmd with the content from this gist.
Then render an html with quarto:
quarto render hello.qmd --to html
Beautiful. Now we can render html from qmd.
While we are editing, we can also use the preview command:
quarto preview hello.qmd
ObservableJS
The first step is to make the data available for ObservableJS.
After that we use the {ojs} markup to define the plot.
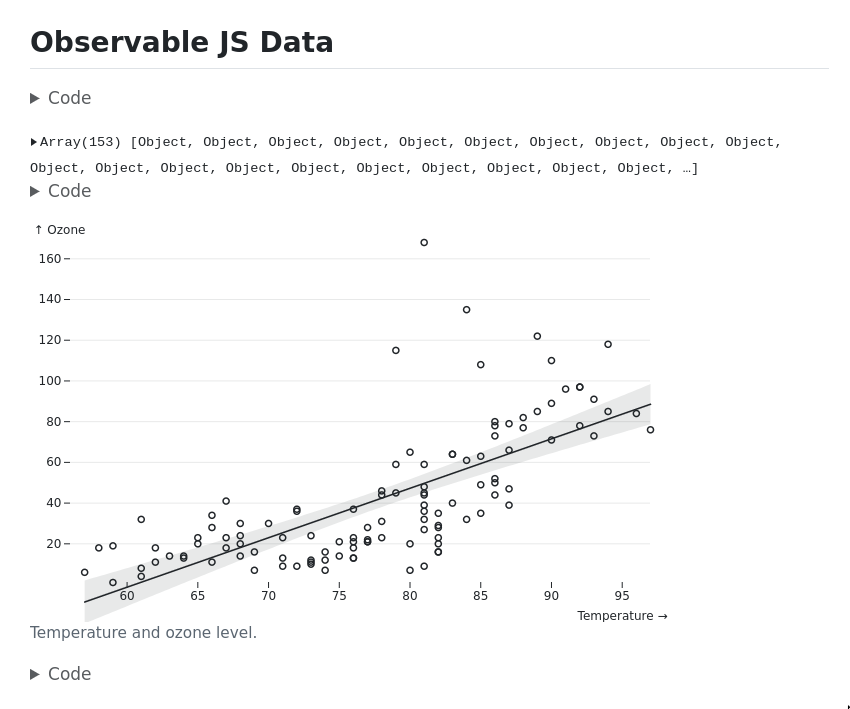
## Observable JS Data

~~~{ojs}
// transpose object
data = transpose(airquality)

// output data
data

// draw plot
Plot.plot({
  style: {
    fontSize: 12
  },
  y: {
    grid: true,
    label: "Ozone"
  },
  x: {
    label: "Temperature"
  },
  marks: [
    Plot.dot(data, {x: "Temp", y: "Ozone"}),
    Plot.linearRegressionY(data, {
      y: "Ozone",
      x:"Temp",
      curve: "catmull-rom"
    }),
  ],
  width: 640,
  height: 400,
  marginBottom: 40,
  marginLeft: 40,
  caption: "Temperature and ozone level."
})
~~~

~~~{r}
// makes `airquality` available to ObservableJS
ojs_define(airquality)
~~~
Beautiful.